colorbar 관련 설정 정리
Code
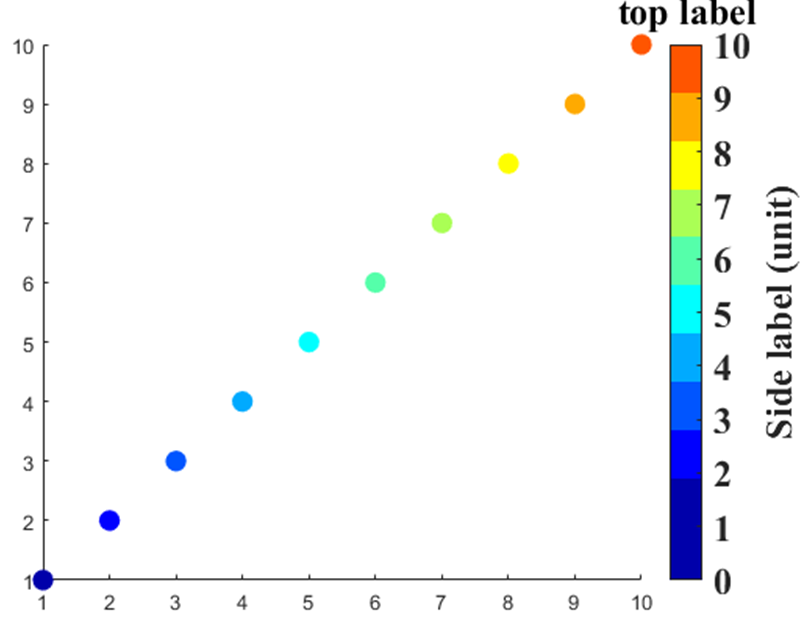
- 그래프 생성
|
figure()
scatter(1:10,1:10,100,1:10,'filled')
|
- colorbar
|
% direction & position
c = colorbar('eastoutside');
% tick set : [ limit / ticks / tick direction / font size ] c.set('Limits',[0 10],'Ticks',[0:1:10],'Direction','normal','FontSize',15)
% side label name c.Label.String = 'Side label (unit)';
% top label name title(c,'top label')
% label font set : [ size / weight / name / direction / out line ] set(c,'FontSize',18,'FontWeight','bold','FontName','times new roman','Box','on')
% theme (theme tick) colormap(jet(10))
|
reference
https://kr.mathworks.com/help/matlab/ref/matlab.graphics.illustration.colorbar-properties.html
https://kr.mathworks.com/matlabcentral/answers/35605-changing-text-orientation-of-lcolorbar
https://kr.mathworks.com/matlabcentral/answers/1449709-adjusting-width-of-horizontal-colorbar
'matlab' 카테고리의 다른 글
| [ matlab ] textscan (0) | 2023.07.31 |
|---|---|
| [ matlab ] 데이터 읽기 방법 (textscan / importdata) (0) | 2023.06.05 |
| [ m_map ] m_map 사용법_2 (지도 생성) (0) | 2023.05.03 |
| [ matlab ] table ↔ matrix (0) | 2023.05.03 |
| [ matlab ] subplot 활용 (0) | 2023.04.21 |